
Compare Dubai property areas using one scorecard.
Place locations side by side before you compare individual buildings. The labels describe broad market context and must be checked against current transaction, rental, cost and supply evidence.
Select two or three areas. The table compares investment context—not projected returns.
| Investment factor |  Downtown Dubai Downtown Dubai | 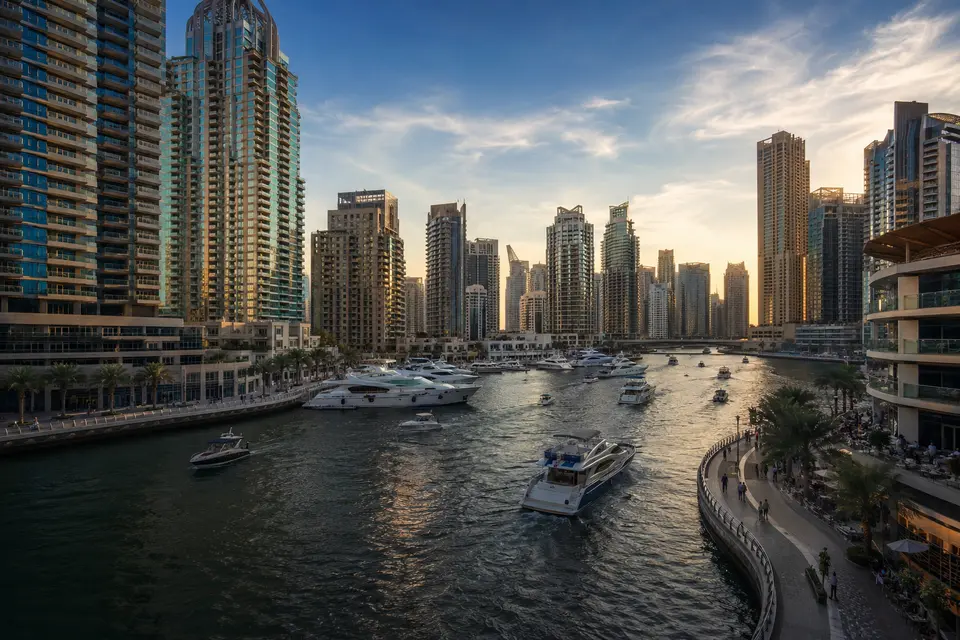 Dubai Marina Dubai Marina |
|---|---|---|
| Positioning | Premium | Upper mid |
| Rental demand | Strong | Strong |
| Resale liquidity | High | High |
| Supply watch | Medium | Medium |
| Likely tenants | Professionals and executives · Tourists and short-term guests · Corporate tenants | Professionals · International tenants · Holiday guests |
| Demand drivers | Global tourism and events · Downtown offices · Dubai Mall and attractions | Established waterfront lifestyle · Marina Walk and retail · Metro and tram access |
| Main risks | High entry price · Service-charge sensitivity · Seasonal short-term demand | Ageing buildings · Service-charge variation · Traffic congestion |
| Verify first | Tenant and buyer profile · Building-specific service charges · Comparable transactions | Building age and maintenance · View and floor premium · Service charges |
100% FREE · NO CREDIT CARD
Start free →Learn the complete area-analysis process.
Lesson 2 explains how to move from an area thesis to building and unit evidence.